Template
Chart and diagram templates
This small pack covers three charts people reach for most often.
Download the template
Download everything
All 3 versions, in Word and PDF, in one ZIP file (1.2 MB).
How to use it
- Pick the template that matches what you need to show: figures, priorities or steps.
- Fill in the headings with your own categories, labels or step names.
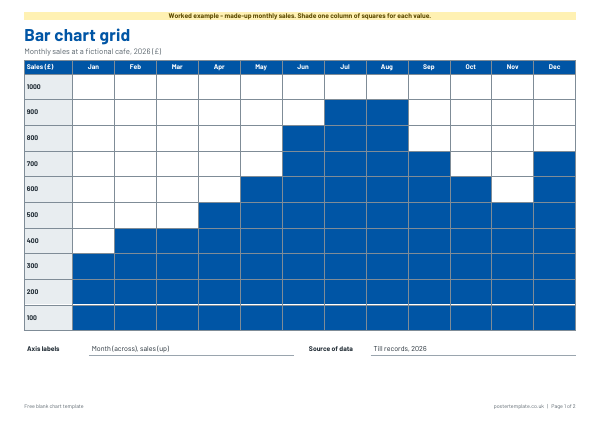
- For the bar chart, write a scale down the side, then shade squares up to each value.
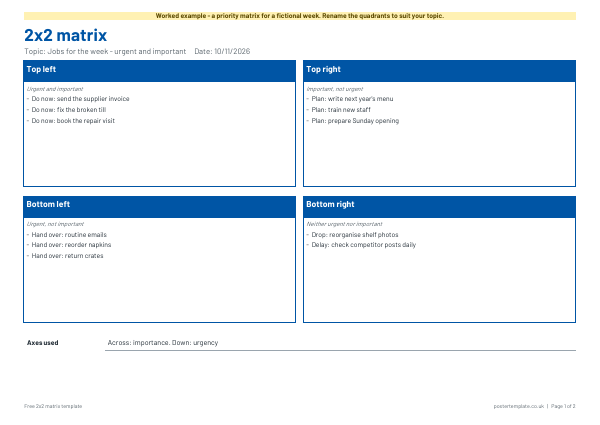
- For the matrix, decide what each axis means and place your items in the boxes.
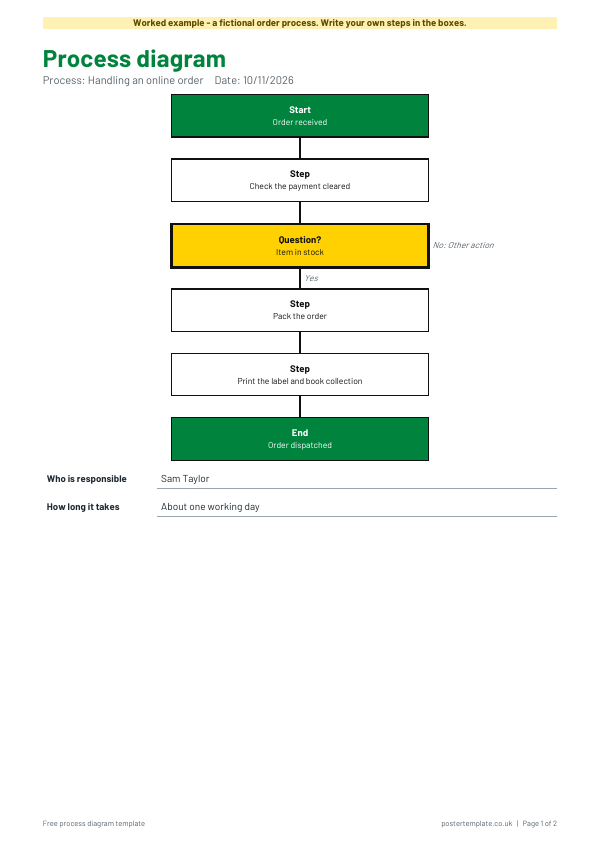
- For the process diagram, write the start and end first, then fill in the steps between.
About this template
The bar chart grid is a blank, ready-ruled sheet for plotting figures by hand. The 2x2 matrix sorts ideas or tasks on two measures at once, such as urgent against important or effort against impact. The process diagram sets out the steps of a task in order, with a decision point. Each template is free to download as Word and PDF, with a blank version and a worked example, and you can rename every heading to suit your own topic.
Questions
Can I make these charts on a computer?
Yes. Open the Word file and type into the boxes, or print the PDF and fill it in by hand.
What scale should I use on the bar chart?
Choose even steps that fit your biggest value, and start at zero so bar heights compare fairly.
What can I use a 2x2 matrix for?
Prioritising tasks, comparing ideas by cost and value, or sorting problems by effort and impact.
Is there a template for other diagrams?
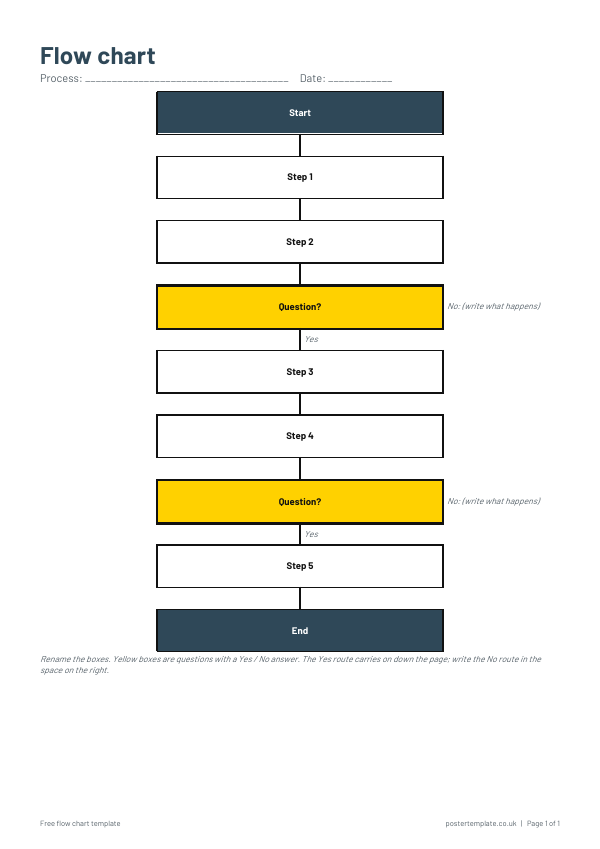
See our flow chart, org chart and SWOT analysis templates in the related list.
Related templates
 Flow chart templates
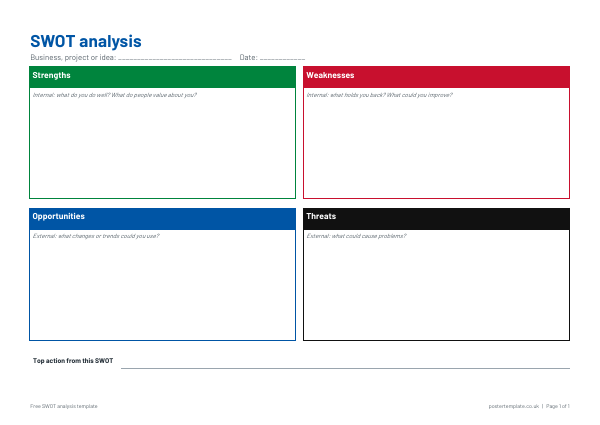 SWOT analysis templates
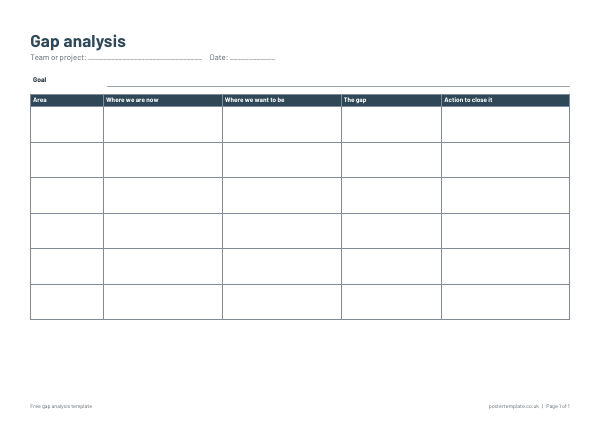 Gap analysis templates
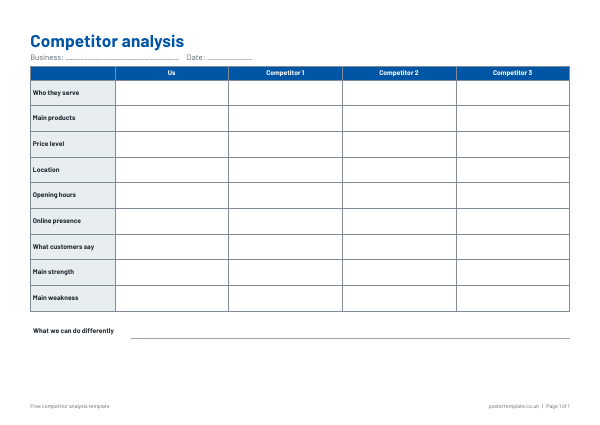 Competitor analysis templates
Free, no sign-up. Edit the Word file or print the PDF. All templates